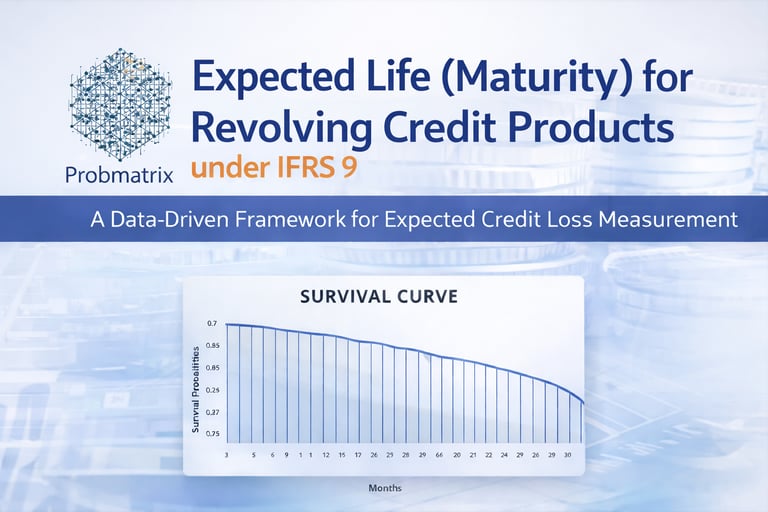
Expected Life (Maturity) for Revolving Credit Products under IFRS 9
This article explores how behavioral maturity provides a robust, IFRS 9 aligned framework for measuring expected credit loss horizons in revolving credit portfolios. Using survival analysis, it demonstrates how exposure duration can be derived from observed customer behavior rather than contractual assumptions, and explains how expected remaining life is estimated at reporting date. The discussion highlights key modelling insights, governance considerations, and practical implementation using an Excel-based IFRS 9 Add-In.
Syed Muhammad Danyal
2/16/20264 min read

Moving Beyond Contractual Assumptions
Revolving credit products including credit cards, overdrafts, and working capital facilities pose a distinctive challenge under IFRS 9.
Unlike term loans, these products do not have a fixed economic life. Although contractually cancellable at short notice, many facilities remain active for years. Customers draw, repay, and continue using them in ways that often diverge significantly from contractual terms.
This creates a fundamental modelling question:
Over what period should expected credit losses be measured for revolving products?
The answer lies not in contractual maturity but in Expected maturity.
The IFRS 9 Principle
IFRS 9 requires expected credit losses to be measured over the period during which an entity is exposed to credit risk.
For certain revolving facilities, the standard explicitly recognizes that contractual notice periods do not adequately limit exposure. Instead, institutions must estimate the period over which credit risk is actually present based on historical behavior and credit risk management practices.
This shifts the focus from legal maturity to economic reality.
What Is Expected Life?
Expected Life represents the expected period during which a revolving facility remains active and exposes the lender to credit risk.
A facility’s life ends when it is:
Closed by the customer,
Cancelled or materially restricted by the bank, or
Terminated following default.
This definition reflects observed behavior rather than contractual wording.
Why Traditional Approaches Are Insufficient
Some institutions attempt to approximate exposure duration using:
Average account age,
Observed time-to-closure from closed accounts only, or
Contractual assumptions.
These approaches often underestimate true exposure because they:
Ignore accounts that are still active,
Overweight early closures, and
Fail to reflect the persistence observed in long-tenured customers.
Revolving portfolios require a framework that recognizes both completed and ongoing customer relationships.
Data-Driven Approach: Survival Analysis
Survival analysis provides a structured method for estimating how long facilities remain active based on observed historical data.
Rather than focusing solely on closed accounts, this approach evaluates:
The proportion of facilities that remain active over time,
The timing of closures and defaults, and
The impact of credit risk management actions.
The result is a behavioral survival profile that describes how a portfolio naturally evolves.
From this profile, behavioral maturity is derived as the average duration for which facilities remain active.
The Survival Curve: How Customers Actually Behave
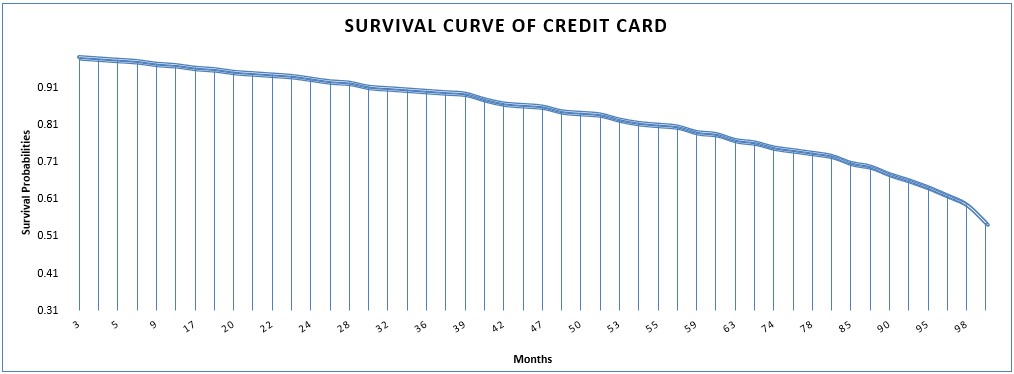
The above chart illustrates how a credit card portfolio evolves over time.
The vertical axis represents the survival probabilities.
The horizontal axis represents months since origination.
Several insights emerge:
Attrition occurs gradually rather than abruptly.
A substantial portion of accounts survive well beyond four years.
A persistent long-term tail extends beyond 80 Months.
This pattern clearly demonstrates that exposure duration materially exceeds contractual notice periods.
The survival curve is not theoretical it is derived directly from historical customer behavior.
Expected maturity is then determined as the average duration represented by this curve.
Remaining Life: The Forward-Looking View
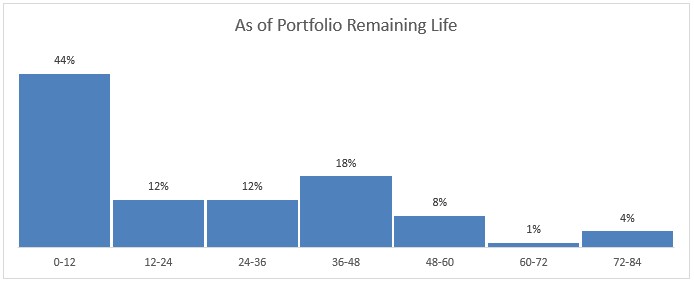

At reporting date, we focus on accounts that are currently active.
The above chart shows the distribution of expected remaining maturity across the current portfolio.
Key observations include:
44% of customers are expected to remain active for up to 12 months.
12% fall in the 12–24 month range & other 12% in the 24-36 month range.
A meaningful 18% are expected to remain active for 36-48 months.
A smaller portion extends beyond 48 months.
On Average the remaining expected life is about 2 Years
This distribution highlights an important reality:
Exposure is heterogeneous.
Some customers are nearing closure, while others are deeply embedded and likely to remain active for years.
Why Longer-Tenured Accounts Often Live Longer
One frequently observed phenomenon is that accounts that have already survived several years often exhibit longer expected remaining life.
This is not a modelling anomaly.
It reflects behavioral persistence.
Customers who survive early attrition phases tend to represent a more stable segment with lower closure propensity. As a result, their expected remaining life may exceed that of a newly originated account.
Why This Matters for IFRS 9
Behavioral maturity directly influences:
Lifetime ECL horizon
Stage 2 exposure measurement
Sensitivity to macroeconomic scenarios
Underestimating maturity may systematically understate exposure.
Overestimating it may inflate provisions unnecessarily.
How to Model Expected Remaining Life with Our IFRS 9 Add-In ®

While survival modelling can be statistically complex, implementation does not need to be.
Our IFRS 9 Excel Add-In enables institutions to model expected maturity and expected remaining life directly within Excel without external statistical software.
Step 1: Upload Historical Revolving Portfolio Data
Users selects account-level historical data.
The Add-In automatically identifies active versus terminated facilities and handles right-censoring appropriately.
Step 2: Generate the Behavioral Survival Curve
Using Kaplan–Meier methodology, the Add-In constructs the Monthly survival probabilities with Tail stability control. The survival curve is generated transparently and can be reviewed, validated, and exported.
Step 3: Calculate Expected Remaining Expected Life
For the current portfolio snapshot, the Add-In:
Determines each facility’s age
Conditions on survival to reporting date
Computes customer-level expected remaining life
Our IFRS 9 Add-In brings that behavioral modelling capability directly into Excel, combining statistical rigor with practical implementation.
“If you would like to see how the Add-In models Expected maturity in practice, feel free to connect.”
Governance and Model Controls
A robust behavioral maturity framework should include:
Explicit treatment of ongoing accounts (right-censoring),
Tail stability controls where long-term data becomes sparse,
Periodic monitoring of behavioral shifts, and
Alignment with documented credit risk management policies.
Conclusion
Under IFRS 9, the exposure horizon must reflect economic reality not legal form. Behavioral maturity provides that economic lens. It translates observed customer behavior into a defensible, data-driven measure of credit exposure duration.
The survival curve reveals how customers actually behave.
The remaining life distribution shows how that behavior translates into forward-looking exposure.
Together, they form a coherent framework for measuring lifetime risk in revolving portfolios.
The adoption of behavioral modelling grounded in survival analysis gain:
Greater accuracy,
Improved stability of provisions,
Stronger audit defensibility, and
Clear alignment with IFRS 9 principles.
Expert risk management tools and consulting services.
Contact
info@probmatrix.io
+92 336 5264744
© 2025. All rights reserved.
Risk Matrix